Intelligent storytelling. Beautifully done.
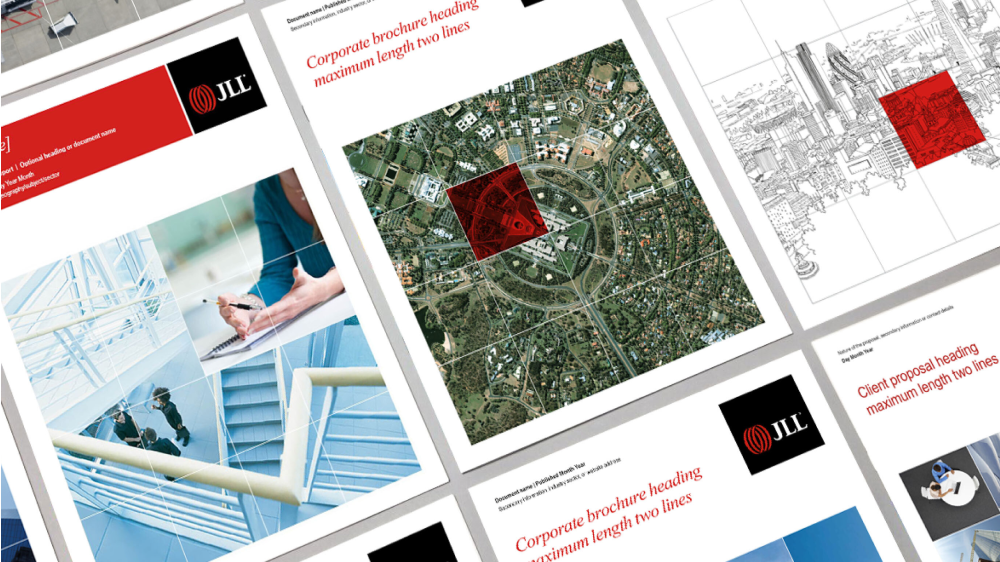
Report design
An annual report is a great way to keep things transparent, build trust with investors and stakeholders, and give a clear picture of your company’s financial health and future plans. Consolidating your year in one place can also help with business decisions and can even open the door to new nvestment opportunities.
An annual report is a great way to keep things transparent, build trust with investors and stakeholders, and give a clear picture of your company’s financial health and future plans. Consolidating your year in one place can also help with business decisions and can even open the door to new nvestment opportunities.
Impact reports are helpful because they show investors and stakeholders what your company stands for and the difference you are making beyond just profit, by highlighting the years achievements and categorising wins against your brands purpose and mission. Key chapters may include social impact, environmental impact and stakeholder engagement, along with a section that looks ahead to the coming year and defines commitments and goals for the future.
An ESG report outlines your company’s performance and commitments in three key areas: Environmental Impact, Social Responsibility, and Corporate Governance. It helps build trust, attract ethical investors, and shows how the business is creating long-term, sustainable value beyond profit.
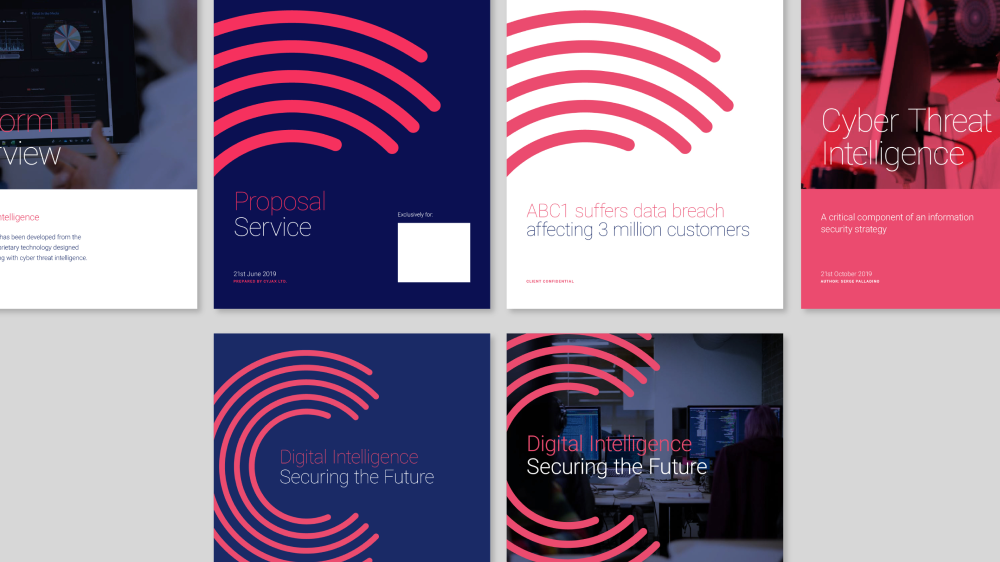
A research report presents the findings of a study or investigation on a specific topic, backed by data and analysis. It’s used to communicate insights, support decision-making, or explore new ideas in a clear and structured way.
A trend report identifies and analyses emerging patterns, shifts, or movements within a specific industry or area of interest. It helps businesses stay ahead by highlighting what’s gaining momentum and why it matters for future strategy.
Thought leadership reports help position your brand as a credible, influential voice. Perhaps drawing from research or trends, this report will present original insights, expert opinions, or forward-thinking ideas on a specific topic or industry.
A whitepaper report is a detailed document that explains a complex issue, solution, or service to help inform or persuade a specific audience. Commonly whitepapers are used in business to build credibility and guide decision-making.
Digital application
A microsite for your report transforms a static document into an engaging, interactive experience. Unlike a traditional printed or PDF report, a dedicated online hub makes your content more accessible and shareable across devices, helping you reach a wider audience and improve stakeholder engagement. It can also help your stakeholders find exactly what they are looking for without having to flick through multiple pages to find it.
Additionally, with analytics built in, you can gain valuable insights into what resonates with stakeholders, allowing you to refine communications year after year.
A video summary of your report makes complex information clear and engaging, helping stakeholders quickly grasp key takeaways. It highlights your company’s achievements and values in a memorable way, builds trust and connection, and is easy to share across platforms. Plus, it’s versatile – clips can be reused for presentations, pitches, and marketing.
Impact comms
Using thought leadership to promote your annual report positions your organisation as an expert and trusted voice in your industry. By sharing insights, trends, and commentary drawn from the report, you go beyond the numbers to demonstrate vision and authority, that strengthens your reputation, and creates ongoing engagement with your audience.
You’ve gathered the data, you’ve published the report – now its time to start shouting about your year’s achievements. A social campaign is a great way of highlighting key achievements in digestible formats like infographics, short videos, or posts, driving attention to the full report while boosting brand awareness. Social platforms also enable two-way interaction, encouraging dialogue with investors, employees, and the wider public, which can strengthen trust and transparency.
AI can transform your report into a natural-sounding podcast that summarises key points and brings to life the content in a digestible listener friendly way. Using advanced text-to-speech tools we can even develop the tone of voice to match your brand, and add music / effects to ensure a polished finish.
Email marketing is a powerful way to promote your annual report because it delivers the highlights directly to stakeholders in a personalised and targeted manner. It allows you to segment audiences – such as investors, partners, or employees – and tailor messages to their interests, ensuring relevance and higher engagement. With visuals, summaries, and clear calls to action, email makes it easy for recipients to access and explore the full report. It’s also measurable, giving insights into open rates and clicks so you can gauge interest and improve future communications.
Infographics promote your annual report by turning complex data into visually appealing, easy-to-understand graphics. They help stakeholders quickly grasp important information, and can be used in sales decks or shared across digital platforms to increase engagement.


Working with us
A creative partner who gets corporate reporting
From shaping the document structure with you, through to design development, stakeholder reviews, print production, and even translations, our experienced team are no strangers to the complexities of creating reports.

Discover
Kicking things off with a collaborative call or workshop, we take time to understand both your business and your goals, so that we can make sure these shine through in the final report design.Discovery may include:
• Research
• Insight gathering

Define
This phase is about bringing together the insight gathered during Discovery, and defining how that is brought to life through visual elements such as typography, imagery, infographics and charts and data.
Definition may include:
• Design exploration and direction
• Defining pagination page count

Design
This phase is geared towards creating a fully- designed first draft that brings your data to life in a succinct and beautiful way.
The design phase includes:
• Full first draft
• Layout design
• Data visualisation
• Photography sourcing
• Proofreading

Deliver
As we near completion, artworking is an essential step, ensuring quality control of the final product.
The delivery phase includes:
• Gaining approvals
• Artworking
• Print management
• Translations
Who we've worked with


Reporting that stakeholders actually want to read
42%
People retain 42% more information when it is presented visually compared to text alone.
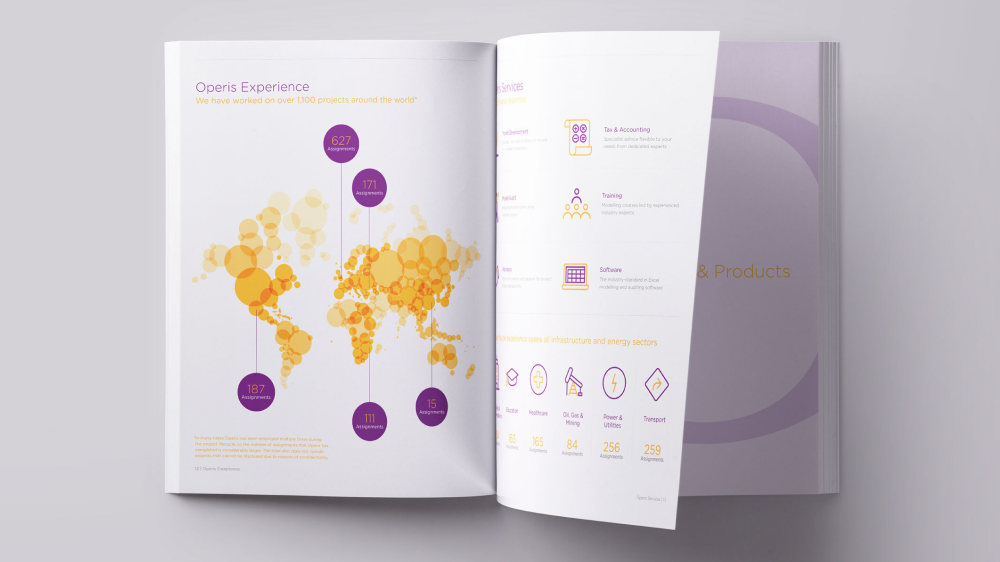
Clarity
Data, charts, numbers... we’ll bring clarity to complex information, to help your audience quickly be able to digest what they are looking for.
Brand
We’ll harness your visual identity to bespokely get the look and feel right for both your brand and your audience.
ROI - Results focussed design
Company sale value increase
£12m to £150m
Linkedln audience increase
+504%
Facebook audience reach
+53,000%
Increased revenue
$9.7m to $20m
LinkedIn impressions
+1,000%
Paid Ad engagement (30 days)
1.4k
Company sale value
£9m to £37.5m
Click through rate (CTR)
48.96%
Facebook page impressions
+5,217%
Increased revenue
£1m to £5m
Increased monthly sales
£1k to £10k
Daily website traffic (30 days):
+200%
